Cloud Computing for Business – Building ROI from Cloud Computing
Many businesses have addressed emerging trends through actions to drive cost reduction and leverage IT service providers’ adoption of cloud-style services. Many industry organizations and leading IT suppliers of software, hardware, and services, seeking to address their customer needs, have vigorously evaluated and followed a cloud-style strategy. The challenges and issues are in the transition from the current traditional IT to the new potential capabilities of cloud computing. They must be expressed in a language that end users can understand, and relate to investment, cost improvements, or business performance.
Return on Investment (ROI) is perhaps the most widely used measure of financial success in business. If you have a proposal to use cloud computing in place of in-house IT, this is how you and others will want to assess it. How do you do this? What are the qualities of cloud computing that affect ROI?
ROI is the proportionate increase in the value of an investment over a period of time. It can be measured in a variety of different ways, but there are just four basic ways to improve it: decrease the investment, increase revenue, decrease costs, and make the return faster. Using cloud computing, you can achieve any of these; but you cannot achieve them all at the same time.
It is the relationship between the factors that counts, rather than the absolute values. If you move to public cloud, you generally decrease investment but increase cost. With private cloud, it is the other way round. You can improve or worsen ROI either way, depending on your revenue and speed of return. Revenue can be increased by improving the delivered features and quality – which enable a higher price to be charged – or by operating on a larger scale. But improvements in features, quality, and scale generally also mean higher costs. You must get the balance right.
Just looking at cloud computing from a technical infrastructure point of view is potentially missing the wider picture of the impact of technology on the business. Overall, what matters is defining the value to business. Value can be defined in many ways. It does not just mean the financial values, but can also mean customer value, seller value, broker value, market brand value, and corporate value. These aspects should not be neglected.
How does cloud computing contribute to ROI? There are a number of fundamental drivers that impact on investment, revenue, cost, and timing that can be positively influenced by using cloud services. They relate to productivity, speed, size, and quality. This chapter describes how each of these drivers contributes to ROI, and shows how to use them to compare cloud and traditional IT solutions, and how to monitor them to maintain and build ROI from cloud computing.
Productivity: More Business with Less IT
The capacity/utilization curve used by Amazon Web Services to illustrate the advantages of cloud computing is often quoted. The figure below uses a similar curve to illustrate the central idea of utility-based services enabled through on-demand provisioning to meet actual usage. The model illustrates the central idea around utility-based services enabled through on-demand provisioning to meet actual usage.
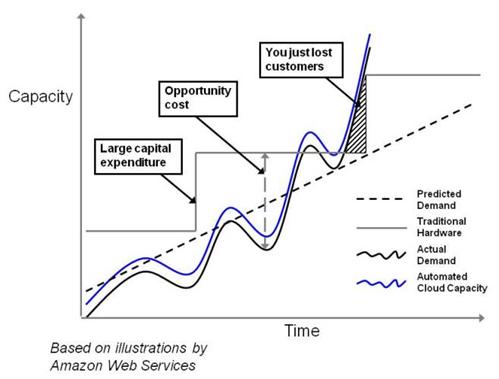
The Capacity versus Utilization Curve
The effect is equally clear in the capacity-utilization chart for Konsort-Prinz’s first year of use of its new cloud-based system, shown earlier. For most of the year, the in-house system would have been used at a small fraction of its capacity, but in the peak month it would not have had sufficient capacity, and business would have been lost.
Resource Utilization
Resources that are sized to handle peak loads are under-utilized at off-peak times. Also, in many enterprises, servers are dedicated to specific functions or departments, and can be massively under-utilized. It is commonplace for departments to request new servers for new projects, even though other departments have capacity that is going begging.
Cloud computing enables resources to be shared by different loads, and thus improves utilization. The sharing can be between enterprises, with public or community cloud, or within an enterprise, with private cloud. The rewards can be high. As an indication of what can be achieved, enterprises that adopt private cloud as a solution are reporting server consolidation ratios of as much as 12 to 1.
At the infrastructure level, resource sharing means supporting many platforms and applications on the same physical resources, using the virtualization techniques described under IaaS in the section on Service Models.
At the platform and application levels, providers can achieve resource sharing through multi-tenancy. For PaaS, this means applications from many clients running on the same operating system. For SaaS, it means clients sharing the same application instance. By doing this, using specially-designed application architectures, they can achieve better utilization of the underlying assets than if each client uses either a separate application instance on the same operating system or another virtualized instance sharing hardware.
Usage-Based Pricing
Usage-based pricing translates the higher utilization achieved by providers into lower costs for consumers.
The benefit to Konsort-Prinz is not that they are using less resource, it is that they are paying for less resource. Their cost curve follows their resource utilization, resulting in a lower total than for a dedicated, under-used system.
Usage-based pricing for software licences gives similar benefits to SaaS users. Traditional licensing associated with ownership, number of users, support, and maintenance costs and services leads to capacity-utilization gaps similar to those for hardware resources.
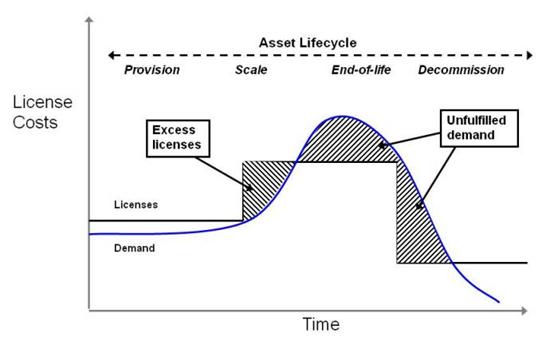
These gaps are being addressed by the pay-as-you-go principle of on-demand cloud computing, which is changing the software cost model.
Specialization and Scale
In addition to the advantages of load sharing, cloud computing can result in lower IT costs because of skill specialization and economies of scale. A large cloud provider – or private cloud division within a corporation – can be much better at providing IT services than a small IT department. And it can amortize the cost of problem-solving over a larger user base: the problems experienced by one user can, once they have been solved, be proactively fixed for all the other users of the cloud service.
Speed: Getting There More Quickly
The second major way in which cloud computing contributes to ROI is through improved speed of operation.
Time to Deployment
Cloud computing provides an increase in provisioning speed, which enables enterprises to acquire the resources they need faster. And, because resource configurations are visible, it speeds up the choice of multi-sourced resources, which can dramatically cut the time to deployment of new products and services. This applies to application and platform resources, as well as to physical infrastructure.
Elastic provisioning creates a new way for enterprises to scale their IT to enable business to expand. The compression of provisioning time from weeks to hours, for example, demonstrated by cloud computing providers is a means to rapid execution that is not just about saving time, but is also defining a new business operating model.
Organizations can review and develop business plans and then deploy infrastructure and services in a more rapid and proactive way. Customization and development, testing, and support can also be seen in a new light with the provision of IT services in a dynamic fashion targeted at business needs.
ViWi provide a prime example of the ability of cloud computing to cut the time-to-market. The company’s founder was a college whizz-kid with a great idea. Using cloud services – which were free for the low usage that was all he wanted – he could quickly build a proof-of-concept program to demonstrate the idea to potential backers. With a ready-to-use cloud development platform, there was no time wasted on buying, installing, and setting up hardware and software. Production versions could be tested in their deployment environment on the cloud, with no need to create special test-bed systems. The time from concept to launch was dramatically reduced, enabling the product to keep ahead of potential competition.
Lifetime Cost Models
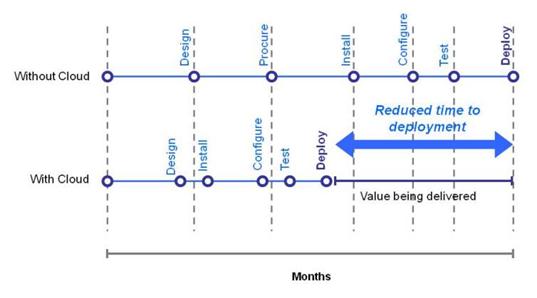
Increased speed of execution has a positive impact on lifetime cost models. Typically, cost is reduced over the lifetime of a product or service as the depreciation cost of purchased assets decreases and as efficiencies are introduced. The speed of cost reduction can be much higher using cloud computing than traditional investment and divestment of IT assets, as illustrated in the figure below.
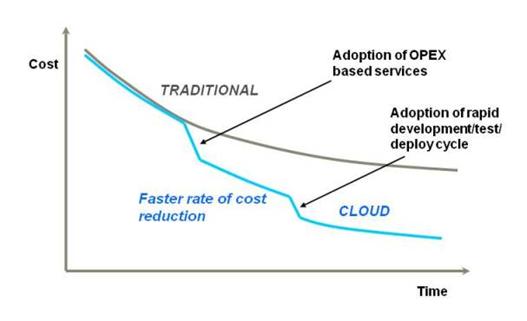
This higher rate of cost reduction means that profitability increases more quickly, giving shorter pay-back times and increased ROI.
IT Asset Management
As well as accelerating business process execution, cloud computing speeds up the process of IT asset management.
The use of IT has become an enduring feature in all organizations today. The investment in data, knowledge, and infrastructure assets and software now represent lifeblood operations for many businesses. But many enterprises have IT asset portfolios that do not reflect their real requirements. The issues of cost of ownership are often decoupled from choices made during selection of new IT, and the impact on the long-term running and maintenance of these IT services and subsequent business usage is not properly considered.
Technology design choices and purchasing are often done by strategic or tactical contractual purchasing based on project requirements, with little consideration for optimizing running and maintenance over the whole system lifecycle, but the cost of maintenance and modifications often represent a significant part of the asset lifecycle beyond initial provisioning.
The ability to “design and provision for run”, so that the choices of IT procurement are aligned with the best options and performance for long-term operation, has long been an ideal goal of business and IT. But, while technical trends such as object-orientation, SOA, and Web 2.0 have brought functional improvements, the improvements in runtime infrastructure support have always been elusive.
A key aspect of moving to cloud computing is the ability to select hardware, software, and services from defined design configurations to run in production. It bridges the design-time and run-time divide and optimizes service performance. Patches and upgrades to the cloud resources are provided as part of the service.
Cloud computing facilitates optimization of the total asset portfolio. It can help an enterprise achieve the goal of a more cost-effective asset–management lifecycle process for the IT portfolio, to optimize both design and run-time performance.
Size: Breaking New Ground
The combination of lower cost and faster delivery makes products and services more competitive, which generates more business and leads to a larger scale of operation. But what makes cloud computing really exciting is that its potential effect on business is not just incremental improvement but disruptive transformation, which it enables through new operating models.
Entering New Markets
Cloud computing removes the need for additional infrastructure to test and enter markets (a key advantage particularly for small to medium-sized organizations). It enables businesses to pursue new and existing markets by rapid entry and exit of the products and services. It enables enterprises to “land and expand” in markets with an infrastructure and service capacity that can grow with the business. Existing and new markets can be attacked and entered through speculative and well-timed interventions to exploit and grow business performance.
High-Value Services
Internet services such as Facebook, MySpace, Flickr, YouTube, and Twitter have become part of our everyday social interaction, and businesses are increasingly making use of IT-based collaboration services for communication, information exchange, and virtual meetings. In many cases, these are not provided by in-house IT; they are cloud services. Use of these services can transform business operation.
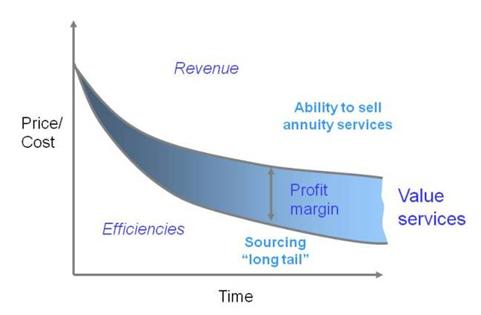
From a provider’s point of view, these are prime examples of simple, high-value services that are massively successful. But they do not have traditional price-based revenue models; they are often free to use. Advertising is one way in which such services can obtain revenue. Another is through offering additional “annuity” services – essential or useful add-ons that are paid for; just as many printer companies make money from the ink cartridges rather than from the printers themselves.
The Long Tail
At the other end of the scope and complexity scale, there are many cases of companies large and small that can enter and develop service offerings through a long tail approach enabled by cloud computing. For any product, most people will be satisfied by a small set of standard features, but there is a “long tail” of potential users that require customization. The ready availability of machine intelligence in the cloud enables this customization to be delivered at a lower cost, so that serving the long tail becomes an economic proposition. (See The Long Tail by Chris Anderson [LONG TAIL].)
Becoming a Cloud Provider
The ability to become a cloud provider is one way in which new business opportunities arise.
Case 16: Service Delivery in Cloud Computing in Use provides an interesting example of this; the telecommunications service provider will provide “network as a service” and “transport as a service” to online consumer service companies. Sam Pan Engineering has it in mind that, if its private cloud is a success internally, then it will offer spare capacity to other companies, as public IaaS. Other opportunities will be to provide value-added cloud services, as ViWi is doing.
Within particular cloud-based business ecosystems there will be many opportunities for specialist service providers. These may include opportunities to provide services that are people-based as well as IT-based, as BPaaS.
Quality: Improved Margin from Better Service
Increased scale and scope of operation delivers more revenue. Efficiencies resulting from better use of assets and faster operation deliver lower costs. The result is a bigger margin, and more profit.
Competitive Pressure
You will not be alone in adopting cloud computing. Your competitors will adopt it too, bringing pressure to cut price and reduce your precious margin. How do you deal with this challenge?
The positioning of cloud computing, while initially seen as a disruptive technology influence on both buyers and seller prospects, is now evolving into a trade-off between low-cost arbitrage and added value QoS.
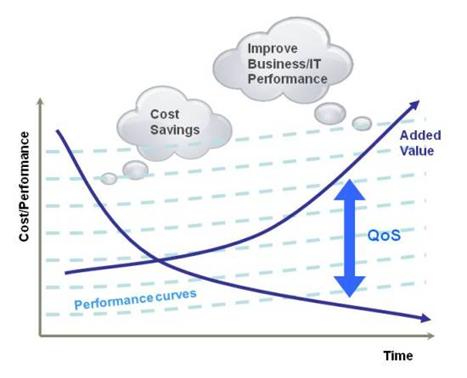
In a market driven by cost, there can be intense competition between participants to make cost savings. This is often seen in a negative context, as the lower costs and margins are seen as a detriment to the participants overall. Massively scalable services from cloud computing providers have the effect of driving down costs and prices, as the dynamics of competition are shifted by the presence of potentially rapid cost reductions.
The Importance of Quality
The counter-balance to this is the quality of service which, taken in comparison to the cost of that service, characterizes the value delivered. Adopting the cloud computing paradigm drives costs down through greater efficiencies of working capital. Some of the gains must go into efforts to improve quality, if margins are to be maintained.
The differentiator of cloud computing is not just the utility computing services, but includes all the higher-level services that enhance and build service value. This is part of a movement from IT-centric to business-centric services across a wider services continuum, with utility services for infrastructure at one end, and with business-centric software and business processes delivered as a service from the cloud at the other.
Comparing ROI of Cloud and Traditional IT Solutions
There are a number of things to consider when deciding whether to use cloud computing. Many of them were described in Establishing your Cloud Vision. They will usually include ROI. If you propose a cloud-based project, you will be asked how the ROI compares with that of a traditional solution. How do you answer this question?
To make the trade-offs between the factors involved, you need a model of how your project will achieve ROI. This model will typically include assets, revenue, workload, costs, time to deliver, features, quality, and scale. It can be in your head, or can be captured by a more or less sophisticated computer modeling tool. Much of the model will be based on normal financial management factors, such as the relation between investment, revenue, costs, and return. Some of these factors will be affected by considerations that are special to cloud computing.
This section illustrates the process, by showing how our three example companies assess the ROI of their cloud solutions. The illustrations use simplified spreadsheet models, which are available for download from The Open Group website [EXAMPLES].
Basis of ROI Calculations
ROI is generally defined as the ratio of money gained or lost on an investment to the amount of money invested. (This definition was abbreviated from the Wikipedia entry for ROI.)
When an investor puts money into a venture in expectation of a return, the calculation of the ROI is straightforward. Our third example company, ViWi, provides an illustration of this.
When the term ROI is used in a corporate environment, as with our first two example companies, the situation is more complicated. In principle, ROI can still be calculated as the gain from the investment divided by the cost of the investment, where the gain is the financial improvement resulting from the investment less the cost of the investment, but it is not always easy to determine what the improvement is or what the cost is, particularly when the investment results in an annual profit or saving for the foreseeable future rather than a one-off benefit.
For Konsort Prinz and Sam Pan, we will take the financial improvement to be how much profit or saving is realized over the first three years of the project, and take the cost to be the amount of money required to make the change that enables the profit or saving.
Konsort-Prinz
The current systems at Konsort-Prinz are not coping with the existing workload, and are limiting the company's ability to do business. The company executives estimate that their turnover and profits would grow by 10% per year if their IT systems were able to handle the increased demand. They have a straightforward decision to make between investing in a major data center upgrade and moving to cloud services. To help them make this decision, they perform comparative ROI calculations for the two proposed solutions. For both calculations, they assume that the costs are incurred during the first year of the project, during which time they continue with their existing IT systems, and that the benefits are realized in years 1 and 2 of the operation of the new system.
They have a budgetary figure of $5M for the data center upgrade, based on quotes received. They take their IT costs of $1.35M for the last financial year as the assumed annual cost of this solution going forward. The cost of operating and maintaining the software application is considered unchanged in both the date center upgrade and the proposed cloud solution. Their calculation is shown in the figure below and gives an ROI over three years of 26%. (These examples ignore cost of capital, inflation, and exchange rate movements. They are important factors in real life, but only serve to confuse the explanations.)
Konsort-Prinz Data Center Upgrade ROI
The move to cloud services will not entirely do away with up-front payments. The company will need to de-commission its data center, including making severance payments to those IT staff that cannot be re-deployed. They budget $2.3M for this. They will also have some software migration costs. They budget $1.2M for these (again, based on supplier quotes).
Their cloud service costs are taken from the workload and cost models that they developed as described in Buying Cloud Services. They have not yet chosen their supplier, but use an annual figure of $550K which seems representative of the three that they have considered. This is based on their current workload, and they increase it by 10% per annum to allow for the increased traffic that they anticipate. The resulting calculation is shown below. The IT costs are shown as a single broad category including specific factors such as audit and security. Similarly, the software migration cost covers all costs associated with the migration, including legal and contract costs. (Note that the numbers are all rounded to two decimal places.)
Konsort-Prinz Cloud Solution ROI
The calculation shows that the cloud solution will give an ROI over three years of 124% – a very significant improvement over the data center upgrade.
Sam Pan Engineering
Sam Pan Engineering has a comparison between continuing the status quo and moving to cloud services. Its corporate executive is considering a proposal to invest $5M in converting about 10% of its servers to private cloud. These servers are massively under-utilized at present, and the proposal assumes a conservative server consolidation ratio of 6:1, so that the cloud servers will do the job of 60% of the servers that the group currently has.
The annual IT costs are currently $25M. The proposal is to keep 40% of the servers, reducing non-cloud IT costs to $10M, and to convert 10% of them to cloud servers, which will then cost $2.5M per year to run. The remaining 50% will be discarded. These will mostly be old machines, with little retained capital value. The proposal includes an investment of $5M to buy and deploy the cloud platform, and for the necessary re-organization of equipment. It assumes that the running costs of the private cloud infrastructure will be the same as the running costs of the current infrastructure. Running a cloud infrastructure is more complicated, but the current costs of managing a silo’ed and not well standardized environment are relatively high, and these factors should balance out.
Sam Pan Engineering ROI Calculation
The calculations show payback of the investment less than five months into the second year, with ROI over three years of 400%.
ViWi
ViWi is the only one of our three example companies to which the term “return on investment” applies in the literal sense. The company has backers who are investing capital, and want to know what return they will get.
ViWi’s founder is asking for $400K which he believes will enable him to establish the company. The backers are looking to invest money over a period of one or two years.
ViWi’s founder does some calculations, produces a nice graph showing revenue and costs, and says that the company will be in profit within a year, and over two years will have an accumulated surplus of revenue less cost of nearly $5M.
ViWi Years 1 and 2 Cumulative Revenue and Costs
Under cross-examination, he explains that this is based on an underlying assumption of 50% per month compound growth in virtual widget use. They ask what if growth is only 10% per month? He admits that this would be a loss-making situation, but points out that 100% per month is perfectly possible also, and this would give a surplus of nearly $12M, just in the first year!
The fact is that this is a very risky investment. The backers must use their business judgement as to the likely take-up of the product, and to assess the risk involved.
They agree to pay $400K for a 50% share in the company. If the value of the company after two years is $3M (which would be roughly the amount of cash generated, after tax, under the founder’s projection), and their share is therefore $1.5M, the ROI over two years would be 375%, as shown below.

The interesting point from the cloud computing perspective is that the risk is in the normal business factors, not in the use of cloud computing. The ROI figures are affected very little by changes in the assumptions made in the cloud workload and cost models, because the costs are directly related to the workload, and hence to the revenue. And there is no capital cost for buying development and deployment systems, which would add to the loss considerably if the product was a failure.
Measuring and Tracking ROI
Clearly the normal financial models showing revenue, capital and operational expenditure, and costs are the main models from which ROI is calculated. For cloud projects, you should also look at indicators of health of the four ROI drivers described earlier in this chapter: utilization, time compression, scale, and quality. These are often the leading indicators of project ROI.
Utilization
Utilization is a key factor that affects productivity, as explained under Productivity: More Business with Less IT.
At the infrastructure level, the instance to asset ratio shows the number of guest operating system instances to physical resource assets. This is a key metric for IaaS providers.
The tenancy to instance ratio measures the number of tenants per resource – see Resource Pooling. This ratio is important to providers of PaaS and SaaS. For PaaS, it is the number of separate platform environments per platform instance. For SaaS, it is the number of client partitions per application instance.
CPU utilizationand memory utilization are important to providers and to IaaS and PaaS consumers. Consumers, PaaS providers, and SaaS providers should look at them in conjunction with workload. If CPU and memory utilization are low then cost reductions can be achieved by allocating more workload to each resource.
Consumers should of course monitor cost, and should look at it in conjunction with workload. If payment is directly related to resource use – “pay-by-the-drink” – then costs should track workload. If there is an element of time-based payment – “pay-as-you-go” – then this may not be the case, and there may be scope to lower costs by tuning resource usage.
Private cloud users often look at the server consolidation ratio – the ratio of servers in their private cloud to those that were used before the cloud was introduced.
Time Compression
These metrics relate to the factors discussed under Speed: Getting There More Quickly.
For consumers of cloud services, speed of provisioning is an important metric. As mentioned earlier, speed of provisioning is crucial for ViWi.
Speed of provisioning contributes to speed of cost reduction, which can provide a long-term indicator of success.
Scale
Scale of operation is discussed under Size: Breaking New Ground.
Workload is probably the best IT measure of this. It should be looked at in conjunction with revenue and cost.
Cloud providers – including providers of private cloud – will also monitor their investment in IT resources.
You may be able to measure market disruption rate as a combination of rate of revenue growth and rate of new market acquisition.
A measure of the complexity of your ecosystem interactions is ecosystem optionality – the number of external assets, APIs, and services that you have to deal with.
Quality
The importance of quality is explained under Quality: Improved Margin from Better Service.
Basic QoS can be measured in terms of availability, reliability, recoverability, responsiveness, and throughput. You may also wish to monitor manageability and security. These are all described for services that you consume under Establishing Requirements; the descriptions apply equally to services that you provide, which is what we are concerned with here.
You should monitor user satisfaction. You cannot rely on your own assessment of the quality that you deliver. It is best to do this proactively. There is a well-known and successful Voice-over-IP supplier that, at the end of each call, gives the user the opportunity to comment on call quality through a simple web form. By contrast there is another provider that, though excellent in many respects, requires complaints on quality to be made to its help desk – but there are many competing providers, it is easier to switch to a different one than to complain, and that is what some users are doing.
Customer retention is a useful indicator of quality. ViWi plan to keep close track of whether their customers continue to use the virtual widgets over a long period, or whether they forget about them after the first few days of interest.
Revenue efficiencies, measured as a combination of margin increase per unit revenue and rate of increase of “annuity” income, can also help you to determine whether you are succeeding in your attempt to respond to competitive pressure by raising quality.
Examples
To illustrate the principles of monitoring cloud ROI, let’s look at how each of our example companies takes stock of its ROI position part-way into its project. To keep things simple, the examples just show indicators for utilization, speed, scale, and quality, mostly with a single indicator for each. The indicators are measured using a scorecard approach on a scale of unacceptable/poor/average/good/excellent.
Konsort-Prinz
The indicators are:
- Utilization – the ratio of used processing power to provisioned processing power
- Speed – the time taken to provision new customers and suppliers in the system
- Scale – the total volume of workload that can be handled in a year
- Quality – user satisfaction, measured through a program of questionnaires and interviews with staff
These are compared with the values of the in-house system, which is the benchmark for “average”. Konsort-Prinz expects an improvement in utilization, and also in scale due to the ability to provision cloud resource, but no significant change in the other figures.
In the third week of November of the first year of operation of the new system, there is a crisis executive meeting. The operations manager says that the system is no good, they are not coping, they will not be able to handle the Christmas rush of orders, there is nothing they can do about it now, but they must scrap the cloud project and invest in a new and bigger in-house system for next year.
The financial implications of this are frightening. The company will make a loss for the year, and lose customers. It will have to borrow heavily to develop a new system – which will be difficult in view of its worsening financial position. It might even go bust.
The ROI scorecard shows that their quality level is unsatisfactory, but the other measures are healthy.
Konsort-Prinz November ROI Scorecard
Utilization is good – and costs are actually marginally lower than forecast. Time taken to provision new customers and suppliers is as expected. The system has not reached any CPU or memory limits, and has plenty of capacity to handle more business.
The main complaint is about response time. The system is very sluggish, and it is taking longer than it should to process orders. The staff that would normally be able to handle the December peak can hardly manage the November workload.
Fortunately, there is a solution. The utilization target was too aggressive. The crisis meeting decides to allow a higher level of resource provisioning to improve response time. This increases costs, but not dangerously so – and the December peak is then handled without any problems.
By taking advantage of cloud scalability, the company has been able to fine-tune its operation and avoid crisis measures.
Sam Pan Engineering
The indicators are:
- Utilization – server consolidation ratio
- Speed – the time taken to convert a server to become part of the private cloud
- Scale – the expected proportion of projects using the private cloud
- Quality – user company satisfaction
Six months into the project, there is no crisis, but the ROI scorecard does give the project team some cause for concern.
Sam Pan Engineering Six-Month ROI Scorecard
Utilization is about as expected, in fact slightly better, with a server consolidation ratio of 8:1. Server conversion time is as planned. The quality indicator is good; despite initial reluctance, the companies that are using the new system are finding that it works well for them. There is even one high-profile water-purification project where ready availability of cloud resource enabled the company to complete some crucial modeling work ahead of schedule. But the scale indicator is disappointing. The constituent companies of the group are resisting the adoption of the new cloud system, and it now looks as though only half of all projects will use it.
Assuming that the investment required will be only half of what was planned, there is no change to the percentage ROI over three years, but the financial improvement is only half of what corporate management was expecting. This is shown below. (Note that the numbers are rounded to two decimal places.)
Sam Pan Engineering Reduced Scale ROI Projection
The project team discusses the situation with corporate management. Because the other indicators are good, the project leaders are able to make the case for exerting more pressure on constituent companies to adopt the new system. Corporate management decides to publicize the success stories more strongly, and to implement budget cuts for companies wishing to keep their in-house IT. This combination of measures brings about the desired improvement in take-up.
ViWi
The indicators are:
- Utilization – the resource cost per widget
- Speed – the compound monthly growth rate in the virtual widget population
- Scale – the expected eventual widget population size
- Quality – the proportion of active widgets and the subscription renewal rate
Six months into the project, there is good news and bad news.
The good news is that they have been able to launch after three months, rather than five months as anticipated. The assumptions about time-to-market, partly based on experience with traditional developments, has proved pessimistic. Also, the scale and quality indicators are looking good. The bad news is that the growth rate in the widget population is only 25%, half of the 50% rate that was assumed. The impact of this is that the project will make a loss of about $360K in the first year, but hopefully show a profit of $200K after two years, giving a ROI of 15%.
ViWi ROI Projection after Six Months
The backers have put in $275K so far. An additional $85K will be needed to carry it through its loss-making period. Should they can the project?
Were it not for the early launch, the answer might well be “Yes!”. But the rapid progress has given confidence and, more importantly, has given some time to show the value of the product. The average proportion of active widgets is 11% as compared with the 5% projected, there have been few subscription cancellations so far, and the widgets are being used in ways that had not been expected, indicating a larger potential market.
The backers agree to continue the project. More than that, they will invest extra money in advertising, to try to increase that growth rate.